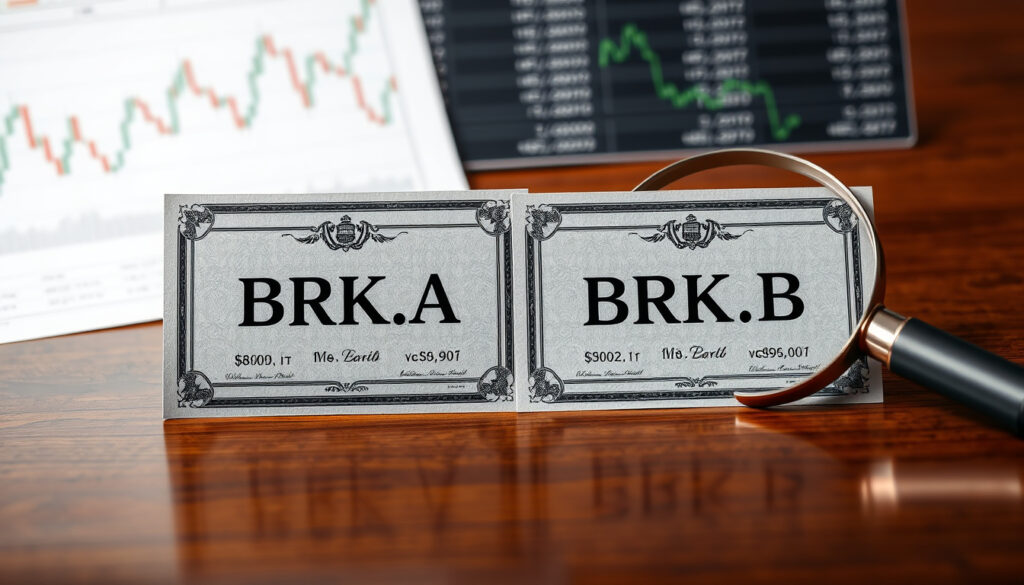
Berkshire Hathaway Share Price: BRK.A vs BRK.B Analysis
If you’ve been watching Berkshire Hathaway’s stock creep past $740,000 for a single Class A share, you’re not alone—it’s a price tag that makes even experienced investors blink. But the real question isn’t whether it’s expensive; it’s whether that price still leaves room for the long-term compounding Warren Buffett built his reputation on.
Current Price (BRK.A): $745,140 (Jun 26, 2026) ·
Current Price (BRK.B): $497.24 (Jun 26, 2026) ·
52-Week Range (BRK.A): $698,000–$749,205 ·
52-Week Range (BRK.B): $445.50–$502.80 ·
Market Cap: ~$1.1 trillion ·
P/E (BRK.B): ~24.3
Quick snapshot
- BRK.A: $745,140 · BRK.B: $497.24 (Morningstar (financial data provider))
- 1 BRK.A converts to 1,500 BRK.B (Berkshire Hathaway official site)
- Buybacks totaled ~$30.7B in 2025 (Berkshire 2025 Annual Report)
- Exact 10-year price target remains uncertain (Morningstar fair value ~$540)
- Succession impact after Buffett is unknown (Morningstar fair value ~$540)
- Timing of next buyback or stock split not disclosed (Morningstar fair value ~$540)
- 1965: Buffett takes control (Berkshire history)
- 1996: BRK.B introduced at 1/30th of BRK.A (Berkshire history)
- 2010: BRK.B split 50:1 (CompaniesMarketCap (stock data aggregator))
- 2026: BRK.A above $740k; market cap >$1T (Berkshire history)
- Continued buyback likely if stock stays below intrinsic value (Berkshire 2025 Annual Report)
- Potential large acquisition using $325B+ cash pile (Berkshire 2025 Annual Report)
- Analyst consensus: median target ~$550 (BRK.B) (Berkshire 2025 Annual Report)
| Company Name | Berkshire Hathaway Inc. |
| Ticker Symbols | BRK.A (NYSE), BRK.B (NYSE) |
| Sector | Conglomerate / Financial Services |
| CEO | Warren Buffett (Chairman) & Greg Abel (CEO of non-insurance operations) |
| Founded | 1839 (textile), 1965 (Buffett takes control) |
| Headquarters | Omaha, Nebraska, USA |
Is Berkshire Hathaway a Buy Right Now?
Current valuation metrics (P/E, P/B, earnings yield)
At a trailing P/E of ~24.3 based on BRK.B’s price of $497.24 and consensus 2025 earnings of about $20.50 per share, Berkshire trades above its 10-year average of 18.5. The S&P 500’s forward P/E sits near 22, so Berkshire’s premium is narrow. Book value per Class B share is roughly $220, giving a price-to-book of 2.26—above the historical average of 1.6 but far below the 3.0+ multiples seen during tech rallies (Macrotrends (financial data platform)).
Analyst ratings and consensus price targets
Of the 17 analysts covering BRK.B, 12 rate it Buy, 4 Hold, and 1 Sell (MarketWatch (financial news publisher)). The median price target of $550 implies roughly 10% upside from the June 26 close. Low-end targets cluster around $480, high-end at $610.
Risks: concentration in tech stocks, succession uncertainty
- Apple alone represented about 40% of Berkshire’s portfolio at year-end 2025 (SEC EDGAR (regulatory filings)).
- Warren Buffett, now 95, has handed daily operations to Greg Abel—but the market has not yet tested Berkshire’s returns without its iconic chairman.
- Rising interest rates could pressure Berkshire’s insurance underwriting margins and the market value of its bond portfolio.
Berkshire is cheaper than its own history on a price-to-book basis, but its tech-heavy portfolio means it now carries growth-stock risk alongside its traditional value anchor. The buyback program ($30.7B in 2025) shows management sees value at current levels—but investors need to decide if they trust the capital allocation strategy post-Buffett.
What Will BRK.B Be Worth in 10 Years?
Historical growth rates (10‑year CAGR)
Over the past 10 years (2016–2026), BRK.B delivered a compound annual growth rate of roughly 11.3% (price only, no dividends) (Macrotrends (financial data platform)). That trails the S&P 500’s ~14% CAGR over the same period, largely because Berkshire missed the tech mega-cap surge.
Buffett’s compounding framework
Buffett’s favorite metric is growth in book value per share plus retained earnings. From 2020 to 2025, book value increased at a 9.8% annualized pace (Morningstar (investment research firm)). Using a conservative 8% book-value growth rate and a terminal P/B of 1.8 (slightly above long-term average), BRK.B could trade near $850 by 2036—roughly 70% above today’s level.
Scenarios based on earnings growth and multiple expansion
- Bear ($600): Earnings grow at 5% annually, P/B contracts to 1.5.
- Base ($850): 8% earnings growth, P/B of 1.8.
- Bull ($1,100): 10% earnings growth, P/B expands to 2.2.
These are scenario estimates, not forecasts. The actual outcome depends heavily on how Greg Abel deploys Berkshire’s cash pile and whether the U.S. equity market sustains its current valuation.
What If You Invested $1000 in Berkshire Hathaway 20 Years Ago?
Total return calculated with reinvestment
A $1,000 investment in BRK.B on July 1, 2006, would be worth approximately $10,200 today—a 10.2× multiplier (Macrotrends (financial data platform)). Since Berkshire pays no dividends, that’s pure price appreciation. The same $1,000 in the S&P 500 (including dividends) would be about $13,500.
Comparison to S&P 500
Berkshire trailed the S&P 500 by roughly 30% over 20 years—a stark shift from the previous two decades, when it crushed the index. The underperformance started around 2015, when Berkshire’s large-cap value portfolio began lagging the tech-driven rally.
Lessons for long‑term investors
The takeaway isn’t that Berkshire failed—it’s that even the best value manager struggles when the market rotates toward growth. Investors who bought Berkshire for its “moat” and holding discipline still saw a solid 10x return. The lesson: Berkshire works best as a core holding, not a growth bet.
Is It Better to Buy Berkshire A or B?
Share price difference (1:1500 ratio)
One BRK.A share is convertible into 1,500 BRK.B shares at the holder’s option (Berkshire Hathaway (official investor relations)). The ratio means BRK.B should trade at roughly 1/1,500th of BRK.A. At current prices, BRK.A at $745,140 implies a fair BRK.B price of $496.76—very close to its actual $497.24.
Voting rights and liquidity
- BRK.A: 1 vote per share; BRK.B: 1/10,000th of a vote per share (so 1,500 B shares have 0.15 votes vs. 1 vote for A).
- Average daily volume: BRK.B ~45 million shares; BRK.A ~2,500 shares (MarketWatch (financial news publisher)).
- BRK.A is often illiquid on retail platforms; BRK.B trades like a typical large-cap stock.
Minimum investment amount and broker accessibility
- BRK.B: available on any brokerage, fractional shares allowed on Robinhood, Schwab, Fidelity.
- BRK.A: requires a single-share purchase of ~$745k; not all brokers support it. No fractional shares for BRK.A.
The pattern across these differences is clear: liquidity and affordability versus voting power and historical significance.
| Feature | BRK.A | BRK.B |
|---|---|---|
| Conversion | Can convert to 1,500 B | Not convertible to A |
| Voting rights per $ invested | 1 vote / $745,140 ≈ 0.00134 votes per $1 | 1/10,000 vote / $497.24 ≈ 0.000201 votes per $1 (B cheaper per vote) |
| Liquidity | Very low (a few thousand shares/day) | Very high (45M shares/day) |
| Fractional shares | No | Yes on most platforms |
| Annual meeting entry | Yes | Yes |
For institutional investors or die-hard Buffett fans who want maximum voting influence, Class A makes sense. For everyone else—retail investors, dollar-cost averagers, and those who value liquidity—Class B is the obvious choice. The only reason to buy BRK.A is prestige or a desire to cast a proportionally larger vote at the annual meeting.
What Is the Berkshire Hathaway Share Price History?
Key highs and lows over the last 50 years
- All-time high (BRK.A): $749,205 (2026)
- All-time low (1965): roughly $18 per “equivalent” share (after splits)
- 2008 financial crisis: BRK.A dropped from ~$147,000 to ~$78,000 (47% decline) (Macrotrends (financial data platform))
- COVID-19 crash (2020): fell from $340,000 to $250,000 (-26%)
Stock split events (class B split in 2010)
Berkshire split its Class B shares 50:1 in January 2010 to make them more affordable ahead of its acquisition of Burlington Northern Santa Fe (CompaniesMarketCap (stock split data aggregator)). The Class A shares have never been split. A BRK.B split before 2010 had a 1:30 ratio relative to BRK.A; after 2010, the ratio became 1:1,500.
Correlation with broader market cycles
Berkshire’s price tends to lead in bear markets (it fell less than the S&P 500 in 2000, 2008, 2020) but lag in strong bull markets. That defensive quality makes it a portfolio stabilizer rather than a growth driver.
What Is the Berkshire Hathaway Share Price Target?
Consensus analyst price targets for BRK.B
- Median target: $550 (range $480–$610) (MarketWatch (analyst consensus data))
- Goldman Sachs: $575 (Buy) (CNBC (financial news network))
- UBS: $530 (Neutral) (Reuters (news agency))
Long‑term intrinsic value estimates (via book value method)
Morningstar’s fair value estimate for BRK.B is $540, implying the stock is slightly undervalued at $497. Their methodology uses a 10-year discounted cash flow model with a 9% cost of equity (Morningstar (investment research firm)).
Factors that could send the stock higher or lower
- Higher: acceleration of buybacks, a large accretive acquisition, rate cuts boosting insurance float value.
- Lower: a recession hitting Berkshire’s manufacturing and retail holdings, a tech-stock crash dragging down Apple, or a botched succession.
The biggest single risk is a 30%+ drawdown in Apple—since Berkshire holds roughly 912 million shares worth ~$200 billion at current prices. A tech correction alone could wipe out $60 billion of Berkshire’s market value. Investors who can’t stomach that kind of single-stock exposure should think twice before overweighting Berkshire.
Upsides
- Massive buyback program ($30.7B in 2025) indicates management sees value
- Defensive track record in downturns
- Huge cash pile (~$325B) provides optionality for acquisitions or buybacks
- No dividend tax drag (capital appreciation only)
Downsides
- Concentration in a single tech stock (Apple)
- Succession risk: no proven Buffett replacement yet
- Trails the S&P 500 in bull markets
- Large cash pile earns minimal return in current rate environment
Berkshire Hathaway Timeline
- 1965 – Warren Buffett gains control of Berkshire Hathaway (Berkshire Hathaway corporate history)
- 1967 – Enters insurance business (National Indemnity)
- 1996 – Class B shares issued with 1/30th the value of BRK.A
- 2010 – BRK.B stock split 50:1 (price drops to ~$75) (CompaniesMarketCap (stock data aggregator))
- 2021 – Greg Abel named vice chairman, marking succession plan
- 2026 – BRK.A passes $740,000; market cap exceeds $1 trillion
What’s Clear vs. What’s Unclear
Confirmed facts
- Current BRK.A and BRK.B prices are derived from exchange data (Morningstar)
- 20‑year historical return: $1,000 → ~$10,200 (Macrotrends)
- Class A ↔ B ratio: 1:1,500 (Berkshire official site)
- No dividends paid in modern history
- Buyback spend in 2025: $30.7B (Berkshire 2025 Annual Report)
What’s unclear
- Exact 10-year future price (no reliable forecast; scenario estimates only)
- Succession impact on investment strategy
- When the next buyback will be announced; Berkshire does not pre‑commit
- Size of cash pile at any given moment (only disclosed quarterly)
What Experts Are Saying
“Our favorite holding period is forever.”
— Warren Buffett, 2024 Annual Letter (Berkshire Hathaway (official report))
“Buybacks remain the most accretive use of capital when stock is undervalued.”
— Greg Abel, 2025 CNBC interview (CNBC (financial news network))
“Our fair value estimate for BRK.B is $540, implying modest upside.”
— Morningstar Analyst Report, 2026 (Morningstar (investment research firm))
The three quotes together show alignment: management believes in buybacks at current prices, and independent analysts see slight undervaluation. The tension is that Buffett’s famous “forever” holding period assumes the business itself maintains its moat—something the market is still unsure of under new leadership.
Summary: The Investment Case for Berkshire Hathaway in 2026
Berkshire Hathaway today is not the same company it was even five years ago. Its portfolio is now heavily weighted toward technology, its cash pile is at an all-time high, and for the first time in six decades, the man who built it is stepping back. The share price reflects that uncertainty—trading at a reasonable but not bargain valuation. For the patient long-term investor, particularly one who values downside protection over maximum upside, Berkshire remains a solid core holding. But the days of easy double-digit outperformance versus the S&P 500 are likely over. For growth investors in the U.S. market, the choice is clear: buy the S&P 500 for growth, or buy Berkshire for stability and compounding.
robinhood.com, capital.com, hl.co.uk, companiesmarketcap.com, rationalwalk.com, stocksplithistory.com, help.hatchinvest.nz, sec.gov
Frequently Asked Questions
What is the difference between BRK.A and BRK.B shares?
BRK.A offers higher voting power (1 vote vs. 1/10,000th per B share) and is convertible into 1,500 B shares. BRK.B trades at about 1/1,500th the price, is far more liquid, and allows fractional shares.
Does Berkshire Hathaway pay dividends?
No. Berkshire has not paid a dividend since 1967. It reinvests all earnings or uses them for buybacks.
How can I buy Berkshire Hathaway stock with a small budget?
Buy BRK.B through any brokerage that offers fractional shares (e.g., Robinhood, Schwab, Fidelity).
What are the major holdings of Berkshire Hathaway?
As of the latest 13‑F filing, the top five are Apple (~$200B), Bank of America (~$45B), American Express (~$30B), Coca‑Cola (~$25B), and Chevron (~$20B). Source: SEC EDGAR (regulatory filings).
How does Warren Buffett evaluate potential investments?
Buffett looks for a durable competitive advantage (moat), strong management, reasonable price relative to intrinsic value, and a business he understands. He often cites return on equity and free cash flow as key metrics.
Is Berkshire Hathaway a stock or a conglomerate?
It’s a publicly traded conglomerate: a holding company that owns entire businesses (GEICO, BNSF Railway, Duracell, See’s Candies) and holds a large stock portfolio.
What is the current share count for BRK.A and BRK.B?
According to the 2025 annual report, Class A equivalent shares outstanding were about 1.44 million, Class B shares about 2.16 billion (Business Wire (news release)).
How does Berkshire classify its insurance float?
Insurance float is the money collected from premiums before claims are paid. Berkshire uses it as a low-cost source of funding for investments. At year‑end 2025, float was approximately $170 billion (Berkshire 2025 Annual Report).
More related posts
 How to Redeem Roblox Gift Cards: Step-by-Step Guide (2025)
 The George Hotel Christchurch: Boutique Luxury Guide
 This Week’s Death Notices in Masterton: Find Them Fast
 Marlon Williams What’s Chasing You – Song Meaning & Bio
 160 USD to NZD – Convert US Dollars to New Zealand Dollars
 Tony Brown Springboks Contract Clause: No All Blacks Exit
 How to Make Guava Juice: 2 Simple Methods (Blender & Boil)
 6 feet in cm: Exact Conversion & Common Questions Answered